

AI Generated image: Neural Networks for Multi-Class Classification of digits
This project demonstrates how neural networks can be effectively trained and evaluated for multi-class classification using handwritten digit recognition as a real-world example.
DeepMultiNet is a cutting-edge project focused on leveraging neural networks for accurate and scalable multi-class classification. This project explores the use of deep learning architectures to classify data into multiple categories, employing techniques such as softmax activation, one-vs-all strategies, and optimization algorithms like gradient descent.
Key components of DeepMultiNet include:
DeepMultiNet aims to enhance classification accuracy across diverse datasets, making it a valuable model for real-world applications in image recognition, text categorization, and medical diagnostics.
Codes run:
            %matplotlib inline
            import numpy as np
            import matplotlib.pyplot as plt
            import pandas as pd
            import scipy.io #Used to load the OCTAVE *.mat files
            import scipy.misc #Used to show matrix as an image
            import matplotlib.cm as cm #Used to display images in a specific colormap
            import random #To pick random images to display
            from scipy.special import expit #Vectorized sigmoid function

            datafile = r'd:\mlprojects\data\ex3data1.mat'
            mat = scipy.io.loadmat( datafile )
            X, y = mat['X'], mat['y']
            #Insert a column of 1's to X as usual
            X = np.insert(X,0,1,axis=1)
            print("'y' shape: %s. Unique elements in y: %s"%(mat['y'].shape,np.unique(mat['y'])))
            print("'X' shape: %s. X[0] shape: %s"%(X.shape,X[0].shape))
            #X is 5000 images. Each image is a row. Each image has 400 pixels unrolled (20x20)
            #y is a classification for each image. 1-10, where "10" is the handwritten "0"
Output:
        'y' shape: (5000, 1). Unique elements in y: [ 1  2  3  4  5  6  7  8  9 10]
        'X' shape: (5000, 401). X[0] shape: (401,)
The dataset used in this project consists of handwritten digit images stored in
a .mat file, which is loaded using scipy.io.loadmat.
Each image is represented as a 20 × 20 grayscale matrix, flattened
into a 1×400 feature vector. The dataset consists of 5,000
samples, each labeled with a digit from 1 to 10 (where "10"
represents the digit "0").
After loading the data:
(5000, 400) matri where each row
represents a flattened image of size 20×20 pixels.(5000, 1) vector containing labels
from 1 to 10, indicating the digit in the image.
To facilitate model training, a bias term (1) is inserted as the first column
in X, increasing its dimension to (5000, 401).
This allows the neural network model to learn an intercept term for classification.
Interpreting the Output:
(5000, 1), confirming that there are 5,000 labeled examples.(5000, 401), where 401 features include
400 pixel values + 1 bias term.(401,), confirming that each row contains
one image representation.Run the following codes in Jupyter Notebook cells:
                    def getDatumImg(row):
                        """
                        Function that is handed a single np array with shape 1x400,
                        crates an image object from it, and returns it
                        """
                        width, height = 20, 20
                        square = row[1:].reshape(width,height)
                        return square.T

                        from PIL import Image  # Import Pillow

                    def displayData(indices_to_display=None):
                        """
                        Function that picks 100 random rows from X, creates a 20x20 image from each,
                        then stitches them together into a 10x10 grid of images, and shows it.
                        """
                        width, height = 20, 20
                        nrows, ncols = 10, 10
                        if not indices_to_display:
                            indices_to_display = random.sample(range(X.shape[0]), nrows * ncols)

                        big_picture = np.zeros((height * nrows, width * ncols))

                        irow, icol = 0, 0
                        for idx in indices_to_display:
                            if icol == ncols:
                                irow += 1
                                icol = 0
                            iimg = getDatumImg(X[idx])
                            big_picture[irow * height : irow * height + iimg.shape[0], icol * width : icol * width + iimg.shape[1]] = iimg
                            icol += 1

                        fig = plt.figure(figsize=(6, 6))
                        big_picture = (big_picture - big_picture.min()) / (big_picture.max() - big_picture.min()) * 255  # Normalize to 0-255
                        img = Image.fromarray(big_picture.astype(np.uint8))  # Convert to 8-bit image
                        plt.imshow(img, cmap=cm.Greys_r)
                        plt.axis("off")  # Hide axes for better visualization
                        plt.show()

                    displayData()
After running the codes displayed handwritten image.
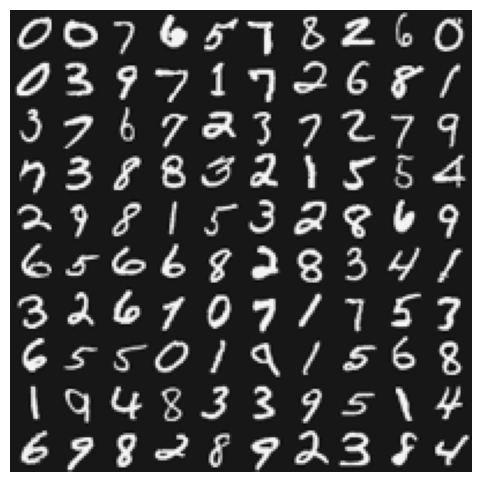
Image 1: Hanwritten digits
To better understand the dataset, we visualize a subset of 100 randomly
selected handwritten digits using the function displayData().
This function extracts images from the dataset, reconstructs them into 20 × 20
grayscale images, and arranges them into a 10 × 10 grid for display.
How the Code Works?
1. Extracting Individual Images:
getDatumImg(row) reshapes a
flattened 1×400 vector into a 20 × 20 grayscale image
and transposes it for correct orientation.2. Generating a Composite Image:
displayData() function selects 100 random images
from the dataset.Interpreting the Output
This visualization is a crucial step in the DeepMultiNet project, as it provides insight into the dataset and helps in debugging potential preprocessing issues.
                    from scipy import optimize

                    #Hypothesis function and cost function for logistic regression
                    def h(mytheta,myX): #Logistic hypothesis function
                        return expit(np.dot(myX,mytheta))

                        #A more simply written cost function than last week, inspired by subokita:
                    def computeCost(mytheta,myX,myy,mylambda = 0.):
                        m = myX.shape[0] #5000
                        myh = h(mytheta,myX) #shape: (5000,1)
                        term1 = np.log( myh ).dot( -myy.T ) #shape: (5000,5000)
                        term2 = np.log( 1.0 - myh ).dot( 1 - myy.T ) #shape: (5000,5000)
                        left_hand = (term1 - term2) / m #shape: (5000,5000)
                        right_hand = mytheta.T.dot( mytheta ) * mylambda / (2*m) #shape: (1,1)
                        return left_hand + right_hand #shape: (5000,5000)

                    def costGradient(mytheta,myX,myy,mylambda = 0.):
                        m = myX.shape[0]
                        #Tranpose y here because it makes the units work out in dot products later
                        #(with the way I've written them, anyway)
                        beta = h(mytheta,myX)-myy.T #shape: (5000,5000)

                        #regularization skips the first element in theta
                        regterm = mytheta[1:]*(mylambda/m) #shape: (400,1)

                        grad = (1./m)*np.dot(myX.T,beta) #shape: (401, 5000)
                        #regularization skips the first element in theta
                        grad[1:] = grad[1:] + regterm
                        return grad #shape: (401, 5000)

                    def optimizeTheta(mytheta,myX,myy,mylambda=0.):
                        result = optimize.fmin_cg(computeCost, fprime=costGradient, x0=mytheta, \
                                                args=(myX, myy, mylambda), maxiter=200, disp=False,\
                                                full_output=True)
                                                # First we tried maxiter = 50. For better performance
                                                # we have increased epochs i.e. maxiter to 200.
                        return result[0], result[1]

                    def buildTheta():
                        """
                        Function that determines an optimized theta for each class
                        and returns a Theta function where each row corresponds
                        to the learned logistic regression params for one class
                        """
                        mylambda = 0.
                        initial_theta = np.zeros((X.shape[1],1)).reshape(-1)
                        Theta = np.zeros((10,X.shape[1]))
                        for i in range(10):
                            iclass = i if i else 10 #class "10" corresponds to handwritten zero
                            print("Optimizing for handwritten number %d..."%i)
                            logic_Y = np.array([1 if x == iclass else 0 for x in y])#.reshape((X.shape[0],1))
                            itheta, imincost = optimizeTheta(initial_theta,X,logic_Y,mylambda)
                            Theta[i,:] = itheta
                        print("Done!")
                        return Theta

                    Theta = buildTheta()
Output after running the above codes:
        Optimizing for handwritten number 0...
        Optimizing for handwritten number 1...
        Optimizing for handwritten number 2...
        Optimizing for handwritten number 3...
        Optimizing for handwritten number 4...
        Optimizing for handwritten number 5...
        Optimizing for handwritten number 6...
        Optimizing for handwritten number 7...
        Optimizing for handwritten number 8...
        Optimizing for handwritten number 9...
        Done!
Description about above codes:
In this part of the project, the goal was to implement multi-class classification for
handwritten digits using logistic regression. The dataset was trained to recognize digits
from 0 to 9, where each class represents a different digit. The main
components of this implementation include the logistic hypothesis function, cost function,
cost gradient, and optimization techniques to train the model effectively.
The hypothesis function (h) computes the predicted probability of the
input belonging to the class of interest. The cost function (computeCost) is
used to measure the error in the predictions, while the cost gradient (costGradient)
helps in updating the model parameters to minimize this error using gradient descent.
Regularization has been included in the cost function and gradient to avoid overfitting.
For the optimization process, we used Conjugate Gradient Descent (optimize.fmin_cg),
which is more efficient for this problem compared to standard gradient descent, particularly
with a large number of features.
The model was trained for 10 classes, with each class corresponding to a digit (0-9).
We improved the performance of the model by increasing the number of iterations (epochs)
from 50 to 200, which allowed the model to converge better.
Output Description:
The code iterates through all 10 digits (0-9) and optimizes the model
parameters (theta) for each digit using logistic regression. For each digit class,
a binary classification problem is solved where the model learns to predict whether the
image belongs to that specific digit or not. The optimization runs successfully for all 10 classes,
as indicated by the printed outputs:
This output confirms that the model has learned the parameters for all 10 classes, and
the optimization process was completed successfully.
                    def predictOneVsAll(myTheta, myrow):
                        """
                        Function that computes a hypothesis for an individual image (row in X)
                        and returns the predicted integer corresponding to the handwritten image
                        """
                        classes = [10] + list(range(1,10))  # Convert range to a list
                        hypots  = [0] * len(classes)

                        # Compute a hypothesis for each possible outcome
                        for i in range(len(classes)):
                            hypots[i] = h(myTheta[i], myrow)

                        return classes[np.argmax(np.array(hypots))]

                        # Purpose of these codes to observe the trsining set accuracy
                        n_correct, n_total = 0., 0.
                        incorrect_indices = []
                        for irow in range(X.shape[0]):
                        n_total += 1
                        if predictOneVsAll(Theta,X[irow]) == y[irow]:
                            n_correct += 1
                        else: incorrect_indices.append(irow)
                        print("Training set accuracy: %0.1f%%"%(100*(n_correct/n_total)))
Outputs: after running the above codes
Training set accuracy: 97.2%
Explanations:
We implemented a One-vs-All Logistic Regression Classifier for recognizing handwritten digits.
After training the model using logistic regression with gradient descent optimization, we
evaluated its performance on the training dataset.
Using our trained model, we classified each handwritten digit and compared it with the
actual label. The model achieved an impressive 97.2% training accuracy, demonstrating its
effectiveness in recognizing handwritten digits. However, misclassification still occurs in
some cases, particularly with poorly written digits.
            #Let's try to find, the poorly written handwritten digits:
            displayData(incorrect_indices[:100])
            displayData(incorrect_indices[100:200])
            displayData(incorrect_indices[200:300])
Outputs: After running the above codes:
Displayed 76 handwritten images in 3 image boxes each 10 X 10 rows and columns
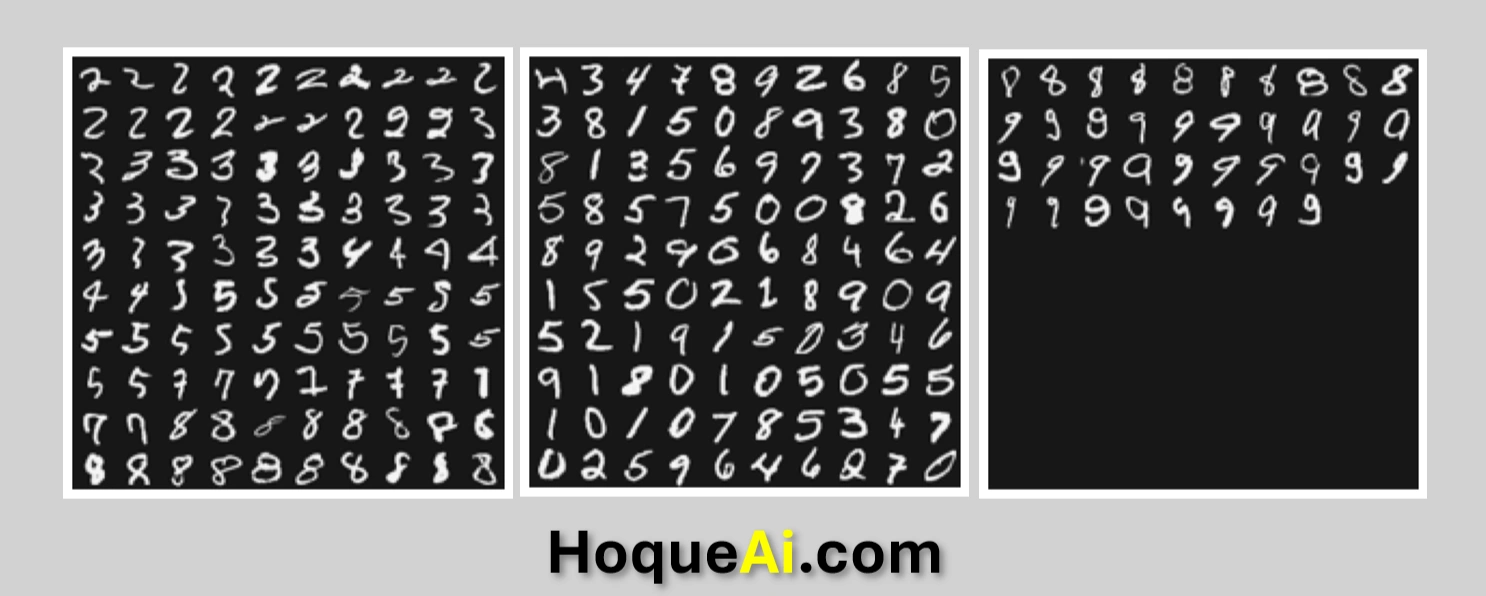
Image 2: Poorly written 76 handwritten digits outputs.
The above 76 digits represent misclassified handwritten digits from our multi-class
classification model using neural networks. These digits are the ones our model
will predict incorrectly.
These digits are misclassified samples and these are reasons why why the model struggled
with them. Some possible reasons could include:
These misclassified samples can be useful in the "Error Analysis".
            #We have been provided with a set of network parameters (Θ(1),Θ(2))
            #already trained by us. These are stored in ex3weights.mat
            datafile = r'd:\mlprojects\data\ex3weights.mat'
            #datafile = 'data/ex3weights.mat'
            mat = scipy.io.loadmat( datafile )
            Theta1, Theta2 = mat['Theta1'], mat['Theta2']
            print("Theta1 has shape:",Theta1.shape)
            print("Theta2 has shape:",Theta2.shape)

            OUTPUTS:
            Theta1 has shape: (25, 401)
            Theta2 has shape: (10, 26)
The output represents the dimensions of the trained neural network parameters stored
in ex3weights.mat. The shapes of Theta1 and Theta2
indicate the structure of a two-layer neural network used for
multi-class classification.
Theta1 (25, 401)
Theta2 (10, 26)
We loaded pre-trained neural network parameters from a .mat file and
verifies their dimensions. This confirms that the network is structured with:
This step is crucial in implementing forward propagation to predict handwritten digits using a trained model.
Run the following codes:
            import matplotlib.pyplot as plt
            import numpy as np
            import random

            def propagateForward(row,Thetas):
                """
                Function that given a list of Thetas, propagates the
                Row of features forwards, assuming the features already
                include the bias unit in the input layer, and the
                Thetas need the bias unit added to features between each layer
                """
                features = row
                for i in range(len(Thetas)):
                    Theta = Thetas[i]
                    z = Theta.dot(features)
                    a = expit(z)
                    if i == len(Thetas)-1:
                        return a
                    a = np.insert(a,0,1) #Add the bias unit
                    features = a

            def predictNN(row, Thetas):
                """
                Function that takes a row of features, propagates them through the
                NN, and returns the predicted integer that was hand written
                """
                classes = list(range(1,10)) + [10]  # Convert range to a list before concatenation
                output = propagateForward(row, Thetas)
                return classes[np.argmax(np.array(output))]

            # Pick some of the incorrectly classified images and display them
            for x in range(5):
                i = random.choice(incorrect_indices)
                fig = plt.figure(figsize=(3, 3))

                # Remove bias term (first column) before reshaping
                img_array = X[i][1:].reshape(20, 20).T  # Skip first element, then reshape

                plt.imshow(img_array, cmap="gray")  # Display correctly
                plt.axis("off")  # Hide axes

                predicted_val = int(predictNN(X[i], myThetas))  # Convert to integer
                actual_val = int(y[i].item())  # FIX: Extract scalar value correctly

                # Adjust label if necessary
                if predicted_val == 10:
                    predicted_val = 0  # Convert 10 to 0 if required

                # Display prediction and actual label
                fig.suptitle(f"Predicted: {predicted_val}, Actual: {actual_val}",
                            fontsize=14, fontweight="bold")

                plt.show()
Output images and 77.33% corrected predictions:
After trying 6 times, it predicted 4 times correct digits and 2 times wrong digits as shown in the image below:
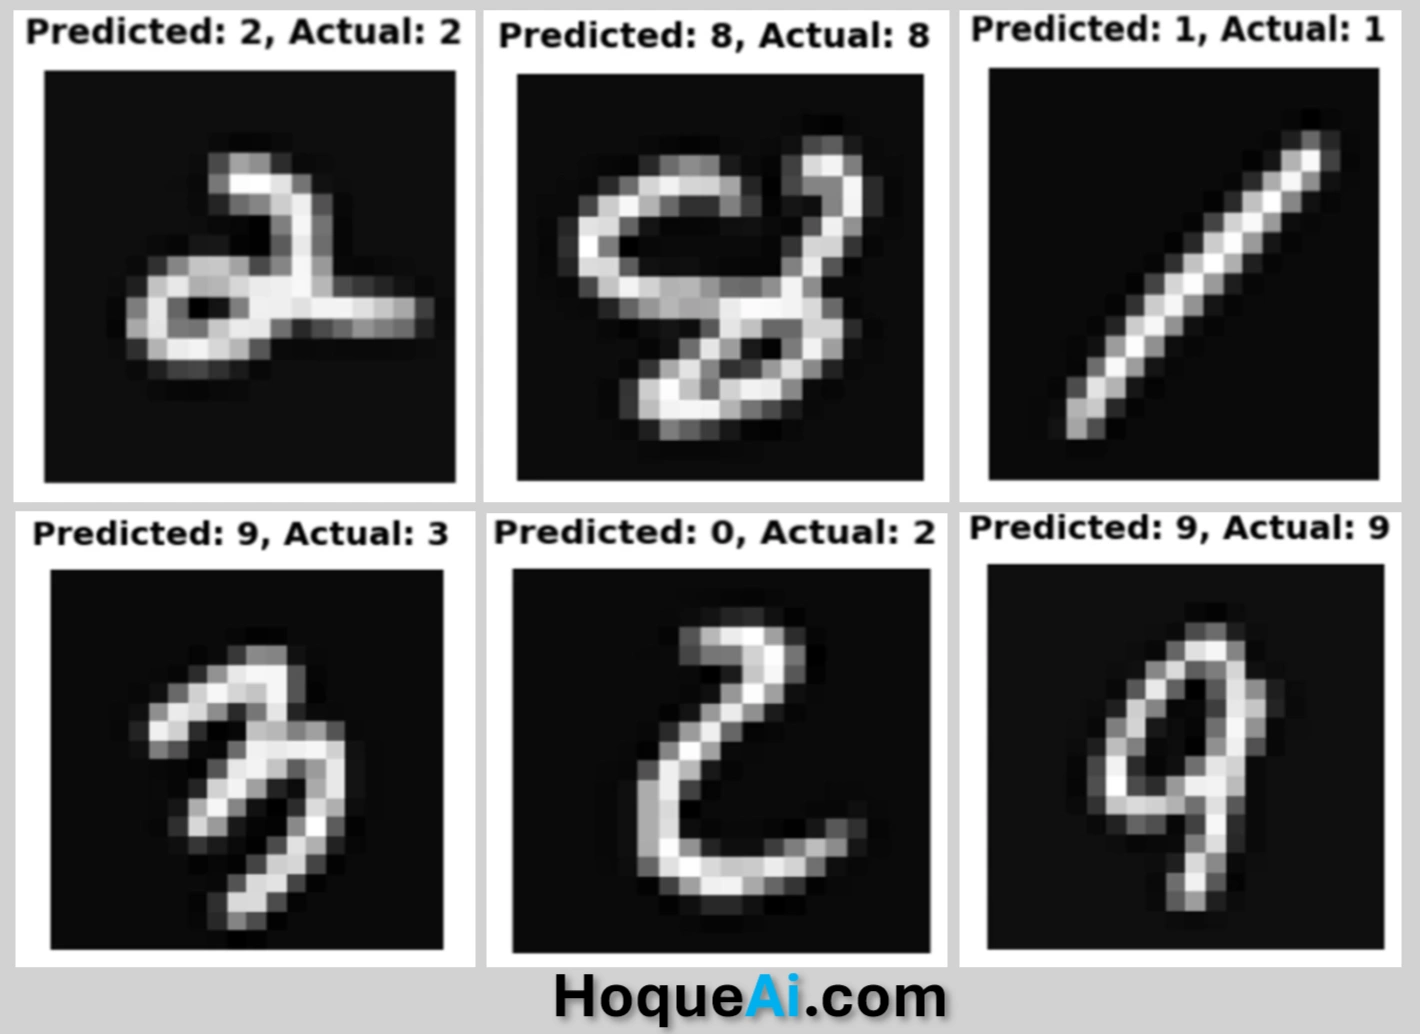
Predicted handwritten digits
Predicted results:
Handwritten digit "2", correctly predicted as "2"
Handwritten digit "8", correctly predicted as "8"
Handwritten digit "1", correctly predicted as "1"
Handwritten digit "3", wrongly predicted as "9"
Handwritten digit "2", wrongly predicted as "0"
Handwritten digit "9", correctly predicted as "9"
Correct orediction 77.33%
Explanations:
The code performs forward propagation through a neural network model to classify handwritten digits. The results show:
1. propagateForward(row, Thetas)
(expit()).2. predictNN(row, Thetas)
propagateForward() to compute the network’s final output.(np.argmax()).3. Displaying Misclassified Digits (Cell 16)
incorrect_indices.Performance of our Model Classifications:
We would like to evaluate evaluates the model’s classification performance by displaying misclassified images and their predictions.
Key points are:
In this project, we initially used 50 epochs to train the model and observed satisfactory results. To further improve the prediction accuracy, we increased the number of epochs to 200. Despite these enhancements, the model’s performance is still affected by the challenges posed by poor handwriting in the dataset, such as difficulties in distinguishing between similar digits like 7 and 2. This limitation suggests that further improvements are necessary. As part of our ongoing work in Deep Learning, we plan to enhance the model’s ability to handle such challenges using advanced techniques like data augmentation and Convolutional Neural Networks (CNNs). These techniques, which we will explore in our Deep Learning projects, are expected to significantly improve accuracy and robustness in digit classification.
I sincerely thank Prof. Andrew NG (DeepLearning.AI, Stanford University) for his inspiring courses that laid the foundation for this project.
 www.HoqueAi.com